WASHINGTON -- U.S. home prices reached a new high in May for the sixth straight month.
The Standard & Poor's CoreLogic national home price index, released Tuesday, increased 5.6 percent in May, the latest data available. It is now 3.2 percent higher than its July 2006 peak.
While the trajectory of price increases in the 20 cities measured by the index has some analysts fearful of another housing bubble, others downplay the notion, and the unrelenting price increases may already be cooling sales. Other aspects of last decade's housing boom and bust, such as rapid sales increases and surging homebuilding, aren't happening now.
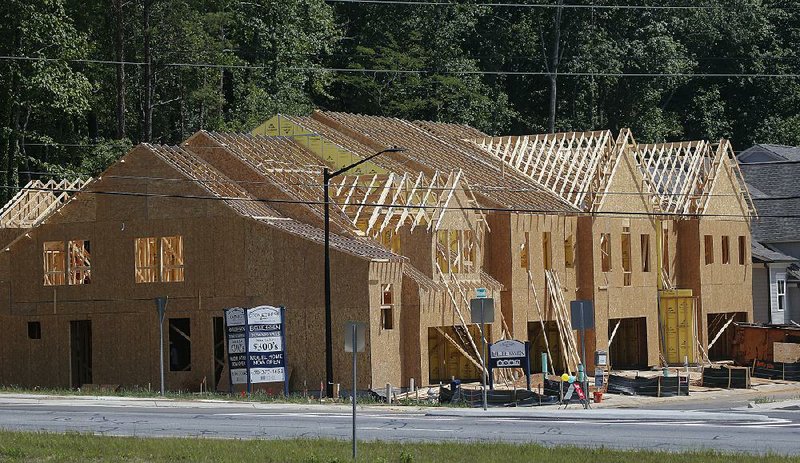
"Price increases vary across the country, unlike the earlier period when rising prices were almost universal," David Blitzer, chairman of the Index Committee at Standard & Poor's, said. "The small supply of homes for sale, at only about four months' worth, is one cause of rising prices. New home construction, higher than during the recession but still low, is another factor in rising prices."
A separate price index maintained by the National Association of Realtors is also rising steadily, though it remains about 9 percent below its 2006 peak. The Standard & Poor's CoreLogic index tracks the same houses over time and is generally considered a better gauge of price changes, while the National Association of Realtors's measure is affected by the proportion of higher-priced or lower-priced homes on the market.
Much of the price gain is being driven by Seattle; Portland, Ore.; and San Francisco. All three cities have strong population growth and more rental properties than other U.S. cities, Standard & Poor's said.
In San Francisco, just 36 percent of homes are owner-occupied, while in Seattle the figure is 46 percent and in Portland, 52 percent. All are below the national average of 64 percent.
From 2010 through 2016, the U.S. population has grown 4.7 percent, Standard & Poor's says. In San Francisco it has grown 8.2 percent, in Portland by 9.6 percent and Seattle, 15.7 percent.
Nationwide, the number of homes for sale has fallen on an annual basis for the past 25 months. There were 1.96 million homes for sale in June, down 7.1 percent from a year earlier.
Rising prices and a limited supply are starting to thwart would-be buyers. Previously owned home sales slipped 1.8 percent in June, the realtors' group said Monday, and are nearly flat from a year earlier.
Even with the decline in sales, there are plenty of interested buyers. The drop in total listings mostly reflects soaring demand, according to real estate data provider Zillow.
The number of homes listed each month has been stable for most of the past five years. About 560,000 homes were put on the market in June, about the same as were listed in June 2016 and June 2015.
But would-be buyers are snapping up homes much faster. According to the Realtors, the typical home is sold in just 28 days, down from 34 days a year ago.
"Sooner or later something will have to give," Svenja Gudell, chief economist at Zillow, said. "Demand will fade, builders will begin delivering more new homes and/or more sellers will start coming out of the woodwork. But for the time being, expect this strong sellers' market to continue."
Information for this article was contributed by Patricia Laya of Bloomberg News.
Business on 07/26/2017