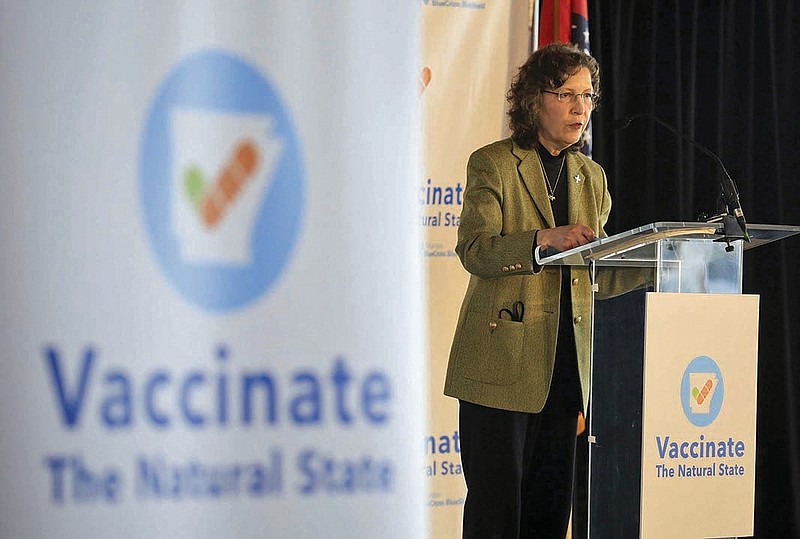
Arkansas has delivered at least one shot of covid-19 vaccine to 36% of state residents and has fully vaccinated one-fourth, or 25%, according to a vaccine-rollout tracking project conducted by The New York Times.
In comparison with the national average over the past several weeks, Arkansas is losing ground, according to the data.
Some 44% of all Americans have received "at least one shot," which 8 percentage points ahead of Arkansas. Six weeks ago, on March 19, the national average sat at 23%, and Arkansas ranked 2 percentage points behind, at 21%.
Below are U.S. states and territories -- along with Palau and the Marshall Islands -- faring best and worst in distributing covid-19 vaccines, as of Friday.
[CORONAVIRUS: Click here for our complete coverage » arkansasonline.com/coronavirus]
The Times uses data from the federal Centers for Disease Control and Prevention. Learn more about the tracking project at: https://www.nytimes.com/interactive/2020/us/covid-19-vaccine-doses.html.
Two of the nation's approved vaccines, Pfizer/BioNTech and Moderna, require two injections to fully immunize a recipient. A third vaccine, by Johnson & Johnson, requires just one shot.
The percentage of residents who have received at least one vaccination in best- and poorest-performing places include:
• Palau: 69%
• New Hampshire: 60%
• Massachusetts: 56%
• Vermont: 55%
• Connecticut: 55%
• Maine: 55%
• Hawaii: 53%
• Rhode Island: 52%
• New Jersey: 52%
• New Mexico: 51%
• U.S. total: 44%
• Indiana: 36%
• West Virginia: 36%
• Arkansas: 36%
• Puerto Rico: 35%
• Georgia: 35%
• Tennessee: 34%
• Wyoming: 34%
• Idaho: 34%
• Alabama: 32%
• Louisiana: 32%
• U.S. Virgin Islands: 32%
• Mississippi: 31%
• Marshall Islands: 25%
• Micronesia: 18%
